From one session to insight across a whole program
Open surgery had the higher success rate for small stones and for large stones, and the lower rate overall. The reason is in trap 4.
Kidney stone treatment · Charig et al., BMJ 1986
Most webinar reports stop at data. A dashboard tells you how many registered, how many attended and the average watch time. The team reads it, agrees it went well, and plans the next session exactly the same way. The insight is usually there already, in what people said, when they leaned in, when they left, and how that changed from one session to the next.
The Adelo teamAdelo Guides
Published 3 November 2026
A researcher's method, from one session to a whole program
Adelo's insight team came out of DOT I/O Health, a data and insight business that spent years working for pharma clients before it became part of Adelo. The biggest lesson from those years is simple: clients never paid for numbers. They paid for the decision the numbers made easier. Everything below is how to get from one to the other, and why a platform that records everything in one place makes that job far easier than it used to be.
01
Start with the decision
Before you open a single report, write down the decision this analysis should help you make. Three questions cover almost every expert event: did we reach the right people, did they value it and learn, and will it change what they do? Then decide what "good" looks like before you see the results. If you don't, you'll find a story to fit whatever comes back.
Layer
What it is
Example
Data
What happened
64% of registrants attended
Insight
Why it happened and what it means
Attendance was strongest among specialists the speaker invited personally
Action
What you'll do differently
Next time, the speaker invites their own network
02
Measure every stage
Every event is a chain: people hear about it, sign up, turn up, stay, take part, learn and, ideally, act. Each link has its own question and its own measures. If one link is weak, everything after it suffers.
Fig. 1The stages
Every stage loses people, so measure all six
Adelo Guides · bar heights illustrative
Stage
What to measure
Watch out for
Reach
Registrations, and the share who match your target audience
Lots of sign-ups from the wrong people
Turn up
Live attendance and total attendance including on demand
Comparing a live-only rate with a combined one
Stay
Engagement minute by minute, and who was there at key moments
An average hiding a mass exit
Take part
Poll response rate, questions per 100 attendees
Counting clicks rather than meaning
Learn
Knowledge checks before and after, stated confidence
Relying on self-report alone
Act
Stated intention, follow-up actions, later evidence
Treating an intention as an action
03
Read engagement against what was said and shown
This is where most analysis stops too early. An engagement curve on its own tells you when people drifted. It can't tell you why. For that you need to know what was on screen and what the speaker was saying at that minute, and what the audience asked straight afterwards.
Adelo captures the transcript alongside every interaction, so engagement, questions, chat and poll answers all sit on the same clock as the slides and the spoken words. That metadata is the most valuable thing a session produces. It turns "attention dropped at 19 minutes" into "attention dropped while a dosing table was read aloud, line by line, and came back when the speaker moved on to a patient case."
Fig. 2Five layers, one clock
The transcript turns a drop into a reason
Illustrative · the layers Adelo captures for every session
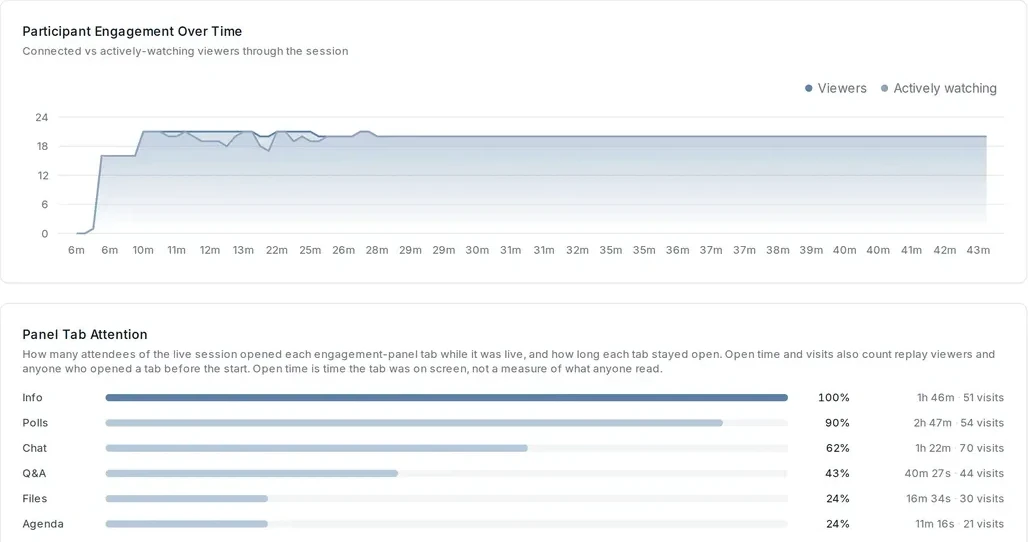
Which panels people opened, and how attention held
123
1Connected viewers against those actively watching, minute by minute.
2Nine in ten attendees opened the polls panel while the session was live.
3Fewer than half opened Q&A, so the moderator reads the best questions out from the stage.
Real Adelo screen · session overview, engagement and panel attention
Look for cliffs. A gentle decline is normal, while a sudden drop points to a moment you can fix.
Read the words at every cliff and every spike. The transcript tells you whether it was the content, the delivery or the slide.
Segment before you conclude. Specialists, generalists and pharmacists often react to the same minute very differently.
Use polls as measurement. Ask the same knowledge question at the start and the end, and see which topics moved.
04
Analyze what people said like a researcher
Questions and chat are the most under-used data in any webinar. Treat them like qualitative research, because that is what they are. The most widely cited method is thematic analysis, set out by Virginia Braun and Victoria Clarke.1 A light version works well for event data: read everything, label each comment, group labels into themes, check the themes against the raw comments, name them, and write them up with how often each came up and who raised it.
Count, but don't only count. One sharp question from a senior specialist can matter more than ten easy ones.
Let AI do the first pass and a person make the final call. A model can suggest codes across thousands of comments in seconds; a person who knows the field decides the themes.
Link every theme to its evidence. In Adelo each question is tied to the moment in the session it was asked, so a theme is never just a label.
Respect the people behind the words. Anonymize examples, and in pharma route anything that could be an adverse event through your process.
05
Advisory boards: the richest data you will ever own
A webinar tells you what a large audience did. An advisory board tells you what a small group of experts think, and why. When an advisory board runs on Adelo you capture even more: who said what, attributed and consented, how each participant voted, and how views moved as the discussion went on. That is primary research, and it deserves a researcher's discipline.
Two principles from qualitative research matter most. The first is saturation. In a well-known 2006 study, Greg Guest, Arwen Bunce and Laura Johnson coded 60 interviews and found that the themes were essentially complete and stable after 12; 34 of the 36 most frequent codes had appeared within the first six.2 For a focused topic, a board of eight to twelve well-chosen experts will surface most of what matters. A second board of different experts is often worth more than a bigger first one.
The second is triangulation: checking a finding against more than one source, method or researcher before you trust it.3 A view the board holds strongly, that also shows up in your webinar questions and your field team's notes, is a finding. A view that appears in only one place is a hypothesis.
Fig. 4Advisory board
How eight experts voted on five statements
Illustrative · votes captured per participant in an Adelo advisory board
06
Look across the whole program
Everything above works for one session. Most of the value appears when you look across many. One webinar is a snapshot; a program of six is a film. You can see which themes grow and which fade, which kind of content loses people every time, which audiences come back and which never do, and whether the questions are getting more sophisticated, which is the best sign that people are actually learning.
Fig. 5The program
Dosing questions fade as access questions climb
Illustrative · questions coded by theme across a six-session program
Code every session the same way, so themes are comparable from one to the next.
Track the same people over time. Repeat attendees and their questions are your best measure of whether the program is working.
Let the last session write the next one. The fastest-growing theme is usually the agenda you should have planned.
07
Connect it to everything else you know
Event data becomes far more powerful next to the data you already have: your CRM and audience lists, market research, medical information enquiries, field or sales notes, usage data. That is triangulation at scale, and it is only practical if your sessions live somewhere you can query. Adelo is the system of record for expert video: every session, recording, transcript, question and consent record in one place, linked to who was there. You can add your other datasets into Adelo AI and analyze them together.
Fig. 6System of record
One record for every session, and the data you add
Adelo Guides
Ask your program a question
With Adelo AI you don't build a dashboard and wait. You search for every moment a topic came up, query by role, region, session or segment, or simply ask a question in plain language, and get an answer that points to the exact moment in the recording, the transcript line or the question it came from.
Ask the way you would ask an analyst
123
1A plain-language question across every session and document in the project.
2Each point in the answer carries a numbered citation.
3Sources point to the exact moment in the recording (0:47) and the page of the document.
Real Adelo screen · the research agent, answering with sources
Clients paid for the decision the numbers helped them make.
The lesson from DOT I/O Health
08
Measure outcomes as well as attendance
In health education, the standard framework comes from Moore, Green and Gallis.4 It sets out seven levels of outcome, from turning up to better population health. Most webinar reports stop at level 2. That's like judging a medicine by how many people collected the prescription and whether they liked the packaging.
Fig. 8Outcomes
Most webinar reports stop at level 2
Moore, Green and Gallis, 2009
Build levels 1 to 4 into the session with planned polls. Then send one short follow-up a few weeks later with a single question: what, if anything, have you done differently since? Across a program, the same question asked after every session shows you whether behavior is actually moving.
09
Avoid the five traps that fool smart people
1. Vanity metrics
Registrations tell you about interest before the event. Lead with the measures tied to your goal.
2. Averages that hide the story
An average watch time of 30 minutes could mean everyone watched half, or half stayed for the hour and half left in the first minute. Look at the distribution, and at the minute-by-minute curve.
3. Small numbers treated as big ones
A poll with 40 responses has a margin of error of roughly plus or minus 15 points; with 100 about 10, with 400 about 5. A swing from 45% to 55% between two small sessions is probably noise. This is another reason to look across a program: the numbers add up.
4. The paradox hiding in your totals
In a 1986 BMJ study of kidney stone treatment, a less invasive procedure succeeded in 83% of patients against 78% for open surgery.5 Yet open surgery did better for small stones (93% vs 87%) and large stones (73% vs 69%), as Julious and Mullee later showed.6 Harder cases went to open surgery more often. This is Simpson's paradox, and it turns up in event data all the time.
5. Targets that eat the measure
Marilyn Strathern summed up Goodhart's law: when a measure becomes a target, it stops being a good measure.7 Reward a team on registrations and you'll get registrations, whether or not they are the right audience.
10
Turn it into a one-page insight report
One-page insight reportAdelo Guides · 03 · Share within two weeks
Headline
Insight
Decisions
You analyze a webinar to make the next one better and the program smarter rather than to prove that this one went well. To get the inputs right, start with our guides on how to run a webinar and how to look good on a webinar.
Frequently asked questions
What metrics should you track for a webinar?
Track every stage: registrations from your target audience, live and on-demand attendance, engagement minute by minute, poll and question rates, knowledge-check results, and stated or actual changes in behavior. Then read engagement against what was being said and shown at the time.
How do you analyze webinar questions and chat?
Treat them like qualitative research. Read everything, label each comment, group labels into themes, check the themes against the raw comments, and report each theme with how often it came up and who asked. AI can do the first pass; a person who knows the field decides the themes.
What makes advisory board data different?
An advisory board gives you attributed, consented views from a small group of experts: who said what, how each person voted, and how views moved during the discussion. Research on saturation suggests around a dozen in-depth conversations surface most of the themes in a focused topic.
Why analyze a webinar program rather than one webinar?
One session is a snapshot. Across a program you can see which themes grow or fade, which content consistently loses people and which audiences come back. That direction of travel is what drives decisions.
What is a system of record for expert video?
One place that holds every session a company runs with experts, live or on demand, together with the recording, transcript, engagement data, questions, polls, approvals and consent records, linked to who was there. It is what lets you compare sessions across a program, prove what was said, reuse content safely and ask questions of all of it at once.
How does Adelo AI help analyze webinar data?
Because Adelo holds every session, transcript, question and consent record in one place, you can search, query and ask plain-language questions across a whole program, add your own datasets such as CRM or market research, and get answers that cite the exact moment in the recording.
Adelo Guides are written by the Adelo team, the professional video event platform for health. They draw on the sessions pharma, agency and consumer health teams run on Adelo every week, and on the research cited in each guide.


 123
 123

 Adelo Guides